Characterization of therapeutic transducers
Relevant parameters and means of measurements

To describe the correct functioning of therapeutic transducers and to establish their performance with respect to their specifications, specific measurements are performed.

Procedures and equipment dedicated to power applications are available at IMASONIC for this important stage of characterization, which follows a specifically-defined test plan drawn up by IMASONIC and the customer for each transducer before its delivery.

For this purpose, IMASONIC has installed several complete power characterization benches. Each bench has an integrated signal generator, a wide band power amplifier (up to 1500 W) and tools for measuring electric power, acoustic power and temperature. Each station has a PC computer to steer the various measurements through software that has been specially written in-house for these measurements. In addition, large-capacity water tanks are equipped with implements adapted to support the transducers, to adjust their position in the tank and to install the various elements required to perform the measurements. The water temperature in the tanks is regulated and its level of oxygenation is maintained at less than 4 mg/l thanks to a degassing system.

Measuring the electric power

It is essential to measure the electric power transmitted to the transducer in order to estimate the level of solicitation of the transducer during testing, but also to ascertain the capacity of transmission back to the transducer of the electric energy coming out of the amplifier. The latter may reveal the necessity to use an impedance matching module.

To measure the electric power, two methods have been deployed: one using a wattmeterreflectometer generally taken at the amplifier output, and measurement of the voltage/current which can be taken as close as possible to the transducer if access to the electrical conductors allows.

The diagram on the right shows the compared measurement of the two methods for which the uncertainty has been evaluated at 6.8 % (k=2) for the wattmeter measuring method, and at 5.3 % (k=2) when using voltage and current probes.

Driving signal: CW at 0.8 MHz
Compared measurement of transmit electric power

At the same time as measuring the electric power, it is often useful to measure the electric impedance of the transducer to complete the information on the electrical adaptation of the transducer to the power amplifier. The electric impedance can be determined by two methods: based on measuring the voltage/current or with an impedance analyser.

Compared measurements are presented in the two figures below, representing the real part of the electric impedance of a transducer (on the left) and its imaginary part (right) by the two methods as a function of the frequency.

Real impedance

Imaginary Impedance

Measuring the acoustic power: the radiation force balance method

By measuring the acoustic power, the energy produced by the transducer can be quantified under given conditions of electric excitation. In general, a description of the level of acoustic power as defined in the specifications (acoustic power divided by the surface of the active area of the transducer, in W/cm²) is sought.

The acoustic power is evaluated by measuring the radiation force on a target placed in the transducer field and suspended from a balance. At IMASONIC, absorbent targets are used, either solid or more recently liquid, according to the principle introduced by the NPL. In addition, a liquid target gives access to determining the acoustic power by a second method  complementary to the radiation force: the buoyancy measurement.

According to the geometry of the transducer, its frequency of operation and the power levels at work, various implementations of this measurement are possible, for which the  measurement uncertainty must be evaluated individually.

Reference

  • A buoyancy method for the measurement of total ultrasound power generated by HIFU transducers
    A. Shaw,
    Ultrasound. Med. Biol., 34(8), p1513-1527, 2008.

Measuring the efficiency of the transducer according to the frequency

On the basis of the measurement of the electric power transmitted to the transducer and of the acoustic power available at the output, the efficiency of the transducer can be evaluated.

Measuring the efficiency according to the frequency reveals, in particular, the maximum efficiency frequency, especially useful when the system operates at a fixed frequency, and determines the frequency band in which the efficiency is greater than a predetermined level, for applications in which a frequency band is required.

The figure on the left below illustrates an efficiency measurement on a HIFU piezocomposite technology transducer. Maximum efficiency proves to be at 900 kHz where it reaches 80%. It should also be noted that this type of piezocomposite transducer can operate in a wide frequency band around the center frequency. The table below gives the bandwidth according to the efficiency level for the example considered.


Efficiency according to the frequency
900 kHz transducer, 150 mm diameter, focused at 150 mm
(Two readings: increasing and decreasing frequencies)

Efficiency Bandwidth Relative bandwidth*
>70% 0.77 to 1.07 MHz 33%
>60% 0.69 to 1.20 MHz 57%
>50% 0.63 to 1.33 MHz 78%

* the relative bandwidth is the bandwidth divided by the center frequency

Characterization of the acoustic field

To qualify the transducer from the point of view of the targeted application, the knowledge of the distribution of energy in the insonified field is essential, as this allows the level of acoustic intensity that can be reached at the focal point to be predicted and compared with the level required by the application. It also allows verification that, for this level at the focal point, the out-of-field intensity does not exceed an acceptable threshold to protect the areas to be spared.

Generally, measurement of the acoustic field is taken using a calibrated hydrophone. The acoustic intensity in the field is recorded at certain points allowing a map to be drawn of the intensity in the scanned area. However, this measurement presents a problem in the case of HIFU transducers because of the intensity levels at work at the focal point. Values of some thousands of W/cm² are commonly reached, which are destructive for the hydrophones.

A promising new method, based on acoustic holography, shows potential for circumventing this difficulty.

For this method, a measurement is performed by hydrophone in a power acoustic field plane at a distance from the transducer where the intensity is lower than in the focal area and potentially non-destructive for a hydrophone adapted for power applications.

The whole field characteristics can then be deduced from this measurement as illustrated hereafter on a single element transducer (2.6 MHz, 40 mm diameter, focused at 40 mm)

First step in acoustic holography procedure is to acquire the field characteristics in a plane perpendicular to the acoustic axis.

In the figure the pressure amplitude map was obtained by hydrophone scanning at 20 mm from the transducer. Note that some inhomogeneities can be observed in the image due to local defects in the transducer active area.

From this measurement, the pressure field on the transducer surface can be deduced using a back propagation model. A usual propagation model can then be used to calculate the whole acoustic field created by the transducer. On the figure below, the normalised pressure amplitude is represented along the acoustic axis.

Data used are obtained by 3 different means giving very similar results:

      
Comparison of acoustic profiles along the acoustic axis

The same comparison is performed on data describing the pressure distribution in a plane containing the acoustic axis. The represented area is a 25 mm x 5 mm rectangle centred on the theoretical focal point at 40 mm from the transducer front face.

References

  • Reconstruction of the Normal Velocity Distribution on the Surface of an Ultrasonic Transducer from the Acoustic Pressure Measured on a Reference Surface,
    O.A. Sapozhnikov, Y.A. Pischchal’nikov, A. Morozov,
    Acoustical Physics Vol. 49, n°3, pp354-360, 2003.
  • Study of piezoelectrical transducers vibrations using laser vibrometry and acoustic holography,
    A. Morozov,
    PhD Thesis n°04–2006, Université Claude Bernard, Lyon, 2006

Characterization of the geometry of the radiating surface

The focal distance of HIFU transducers is largely determined by the shaping of the radiating surface of the transducer. The geometry of the active surface can be assessed mechanically by measuring the altitude on a grid of points.The measured surface can be compared with the theoretical surface, whether it is spherical or more complex (e.g. toroidal or Fermat surface).

In this example, a transducer with a 150 mm diameter focused to 150 mm is steered as if it has an effective ray of 149 mm. All the points measured conform to the theoretical surface at +/- 10% of the wave length (+/- 150 μm to 1 MHz in water), except the two red points which reveal a local shaping fault.

Test of performance over time

Two types of objectives can be distinguished leading to two different tests.

  • The burn-in test, designed to detect and reject as quickly as possible any transducers which are statistically faulty in the very first period of their life (early failures)
  • The ageing test through which the stability of the transducer’s performance over time is described.

These two tests are undertaken for a given level of acoustic power with excitation cycles fixed according to the application, usually a sequence of excitation periods (ON) and rest
periods (OFF). The length of time ON and the ON/OFF duty cycle at a given power level are the determining parameters of use to evaluate the transducer’s performance.

Burning tests

The solicitation level of the burn-in test is set at a level that is greater than or equal to the maximum power level provided for in the application. The test duration should also be significant for the application. During the excitation cycles, the heating of the transducer is controlled. This measurement can be taken using thermocouples implanted in the transducer. A temperature alert is programmed beyond a threshold fixed according to the application and the technology of the characterized transducer.

Example of a burn-in test of 15 min at 20 Wac/cm², with cycles of 10s ON/10s OFF, for a transducer operating at 900 kHz; the heating of the transducer is measured by thermocouples at eight points. In this example, it reaches the maximum value of 20.5 °C.


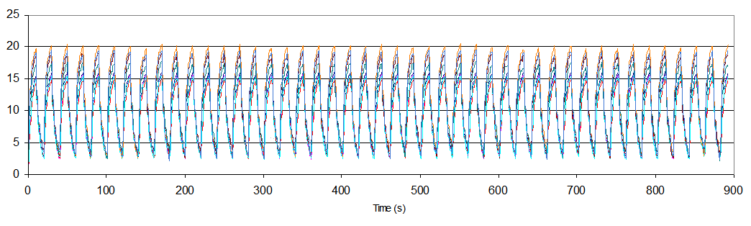
Heating inside the active part of the transducer (8 locations) recorded during 15 min of (10s ON / 10s OFF) excitation cycles

Ageing tests

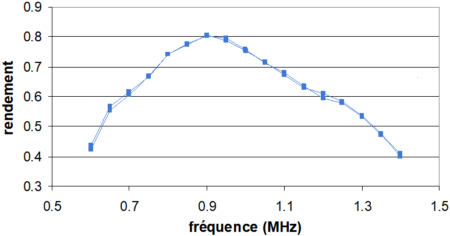
For longer durations, of around the anticipated lifetime for the type of transducer under consideration, an ageing test can be undertaken according to conditions defined on a case by case basis by IMASONIC and the customer. During these tests, in addition to the temperature of the transducer, continuous measurement is taken of the electric power transmitted and reflected, the efficiency, and the electric impedance, which proves to be a good criterion for detecting a transducer malfunction.

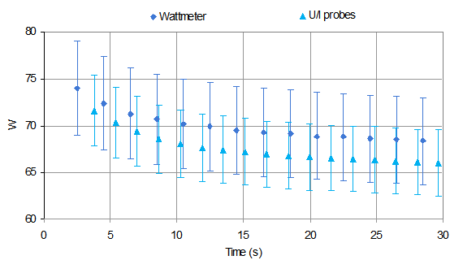
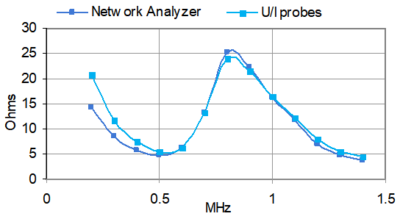
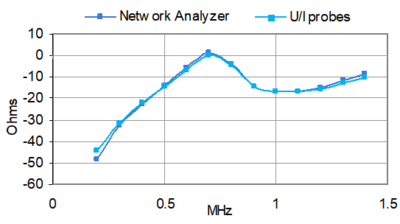
The following curves represent the evolution of the efficiency, temperature and electric impedance of a transducer operating at 900 kHz, tested at 23 Wac/cm², with cycles of 10 ON / 10 OFF during 400 hours. The measurement uncertainties are represented by the dotted curves:


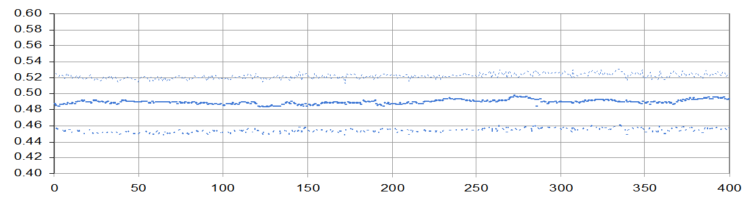
Transducer efficency (%) recorded during the ageing test of 400h


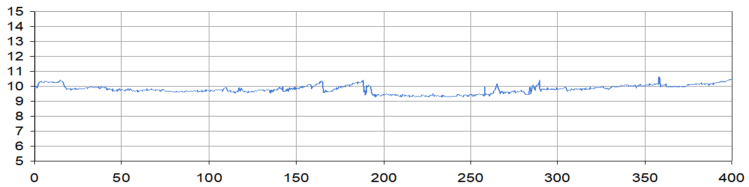
Transducer heating (°C)


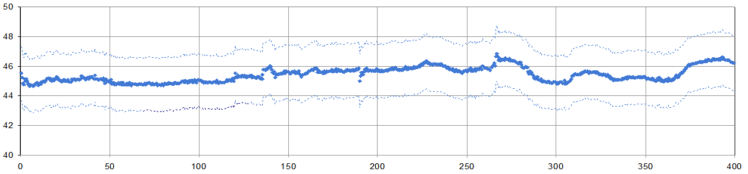
Real part of the impedance (ohms)


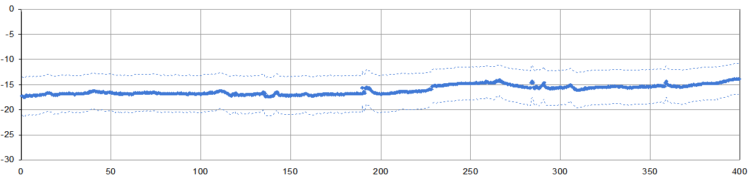
Imaginary part of the impedance (Ohms)

Other characterizations of the correct operation of the transducer

All the HIFU transducers produced by IMASONIC are subject to a dielectric rigidity test undertaken in salt water: this test serves to verify the performance of the transducer at a given level of electrical solicitation, and at the same time to verify the watertightness of the transducer after complete immersion in water for 24 hours.

In the case of multi-element transducers, it is also possible to conduct a test in air to verify the correct electrical connexion of all the elements and their consistency of operation. For this, one or more elements are excited at a low energy level. A temperature map of the front face of the transducer is produced using an infrared camera.

In the example opposite, the homogeneous heating of the 56 circular elements turned on for the test is checked.

Note

Imasonic contributes to the drawing up of standards on the characterization of HIFU transducers. Currently, an IEC working group is preparing two standards projects concerning:

  • Characterization of the acoustic power transmitted by HIFU transducers
  • Characterization of high intensity fields

Related paper

  • High Intensity Therapeutic Ultrasound Transducer Performance and Characterisation
    Gérard Fleury, Rémi Berriet, Laurent Chupin, Jean-Luc Guey, Olivier Le Baron, Baptiste Mainfroy, Théo Martinez – IMASONIC,
    IEEE Ultrasonic symposium, San Diego, 2010.